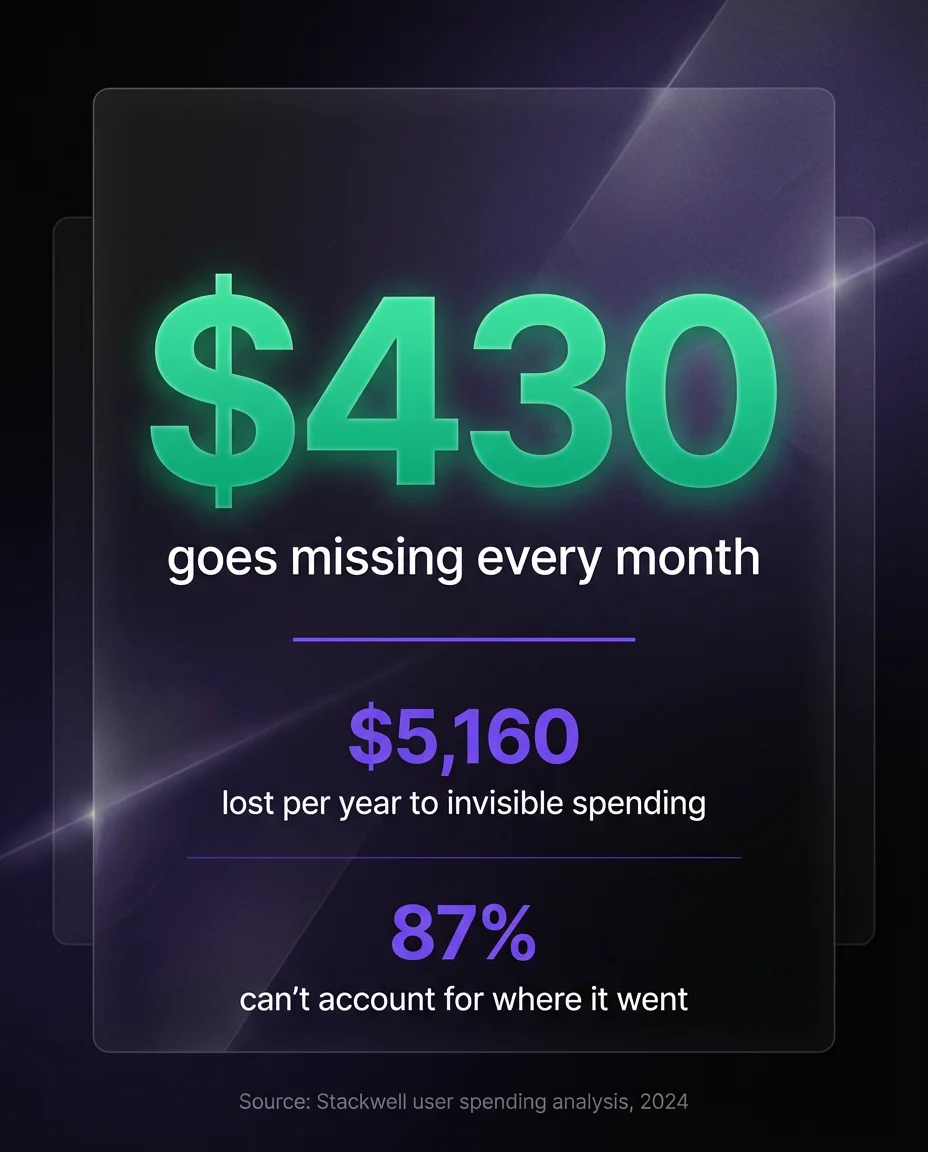
Stat Infographic
Where did $430 go last month?
by Stackwell — Fintech
Ad Details
- Format
- Stat Infographic
- Brand
- Stackwell
- Industry
- Fintech
Why stat infographic ads work
- 1Data-driven hooks create credibility instantly — numbers feel objective even when they're cherry-picked.
- 2The infographic format signals 'worth saving' to the viewer, increasing saves and shares.
- 3Stat ads work as both awareness and consideration content because they educate while they sell.
Generate fintech ads like this for your brand
Try Daily Ads FreeMore fintech ad examples
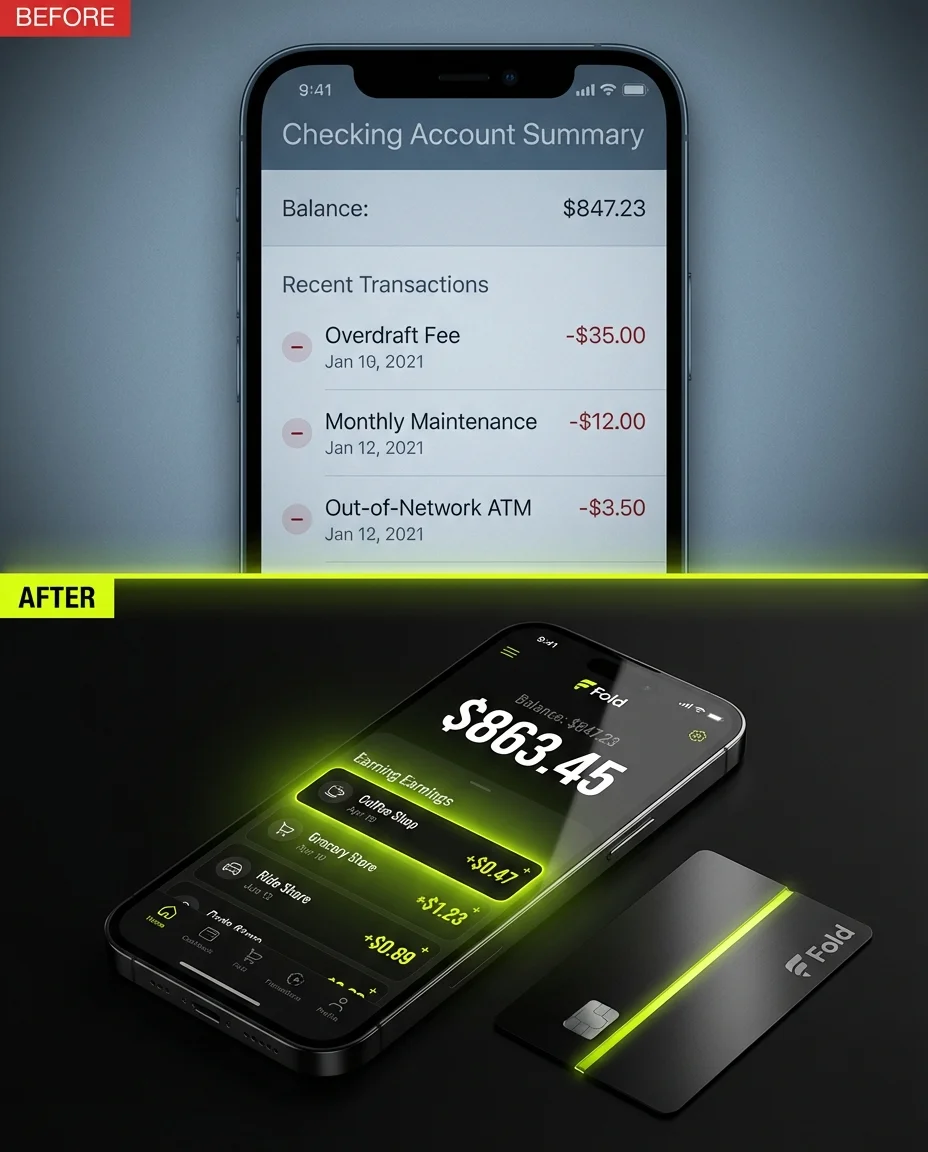
Before & After
Same coffee run. Different bank account.
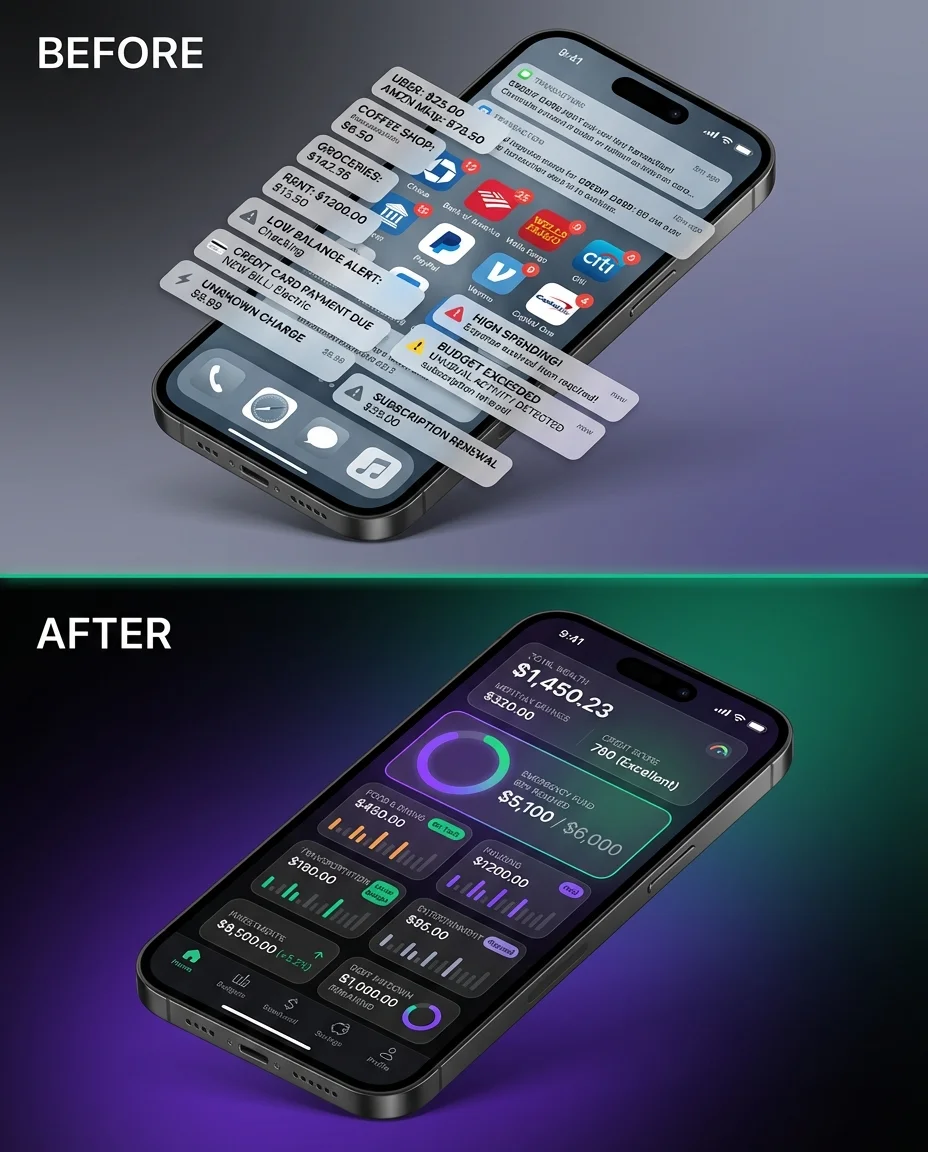
Before & After
Same income. Same expenses. Different clarity.
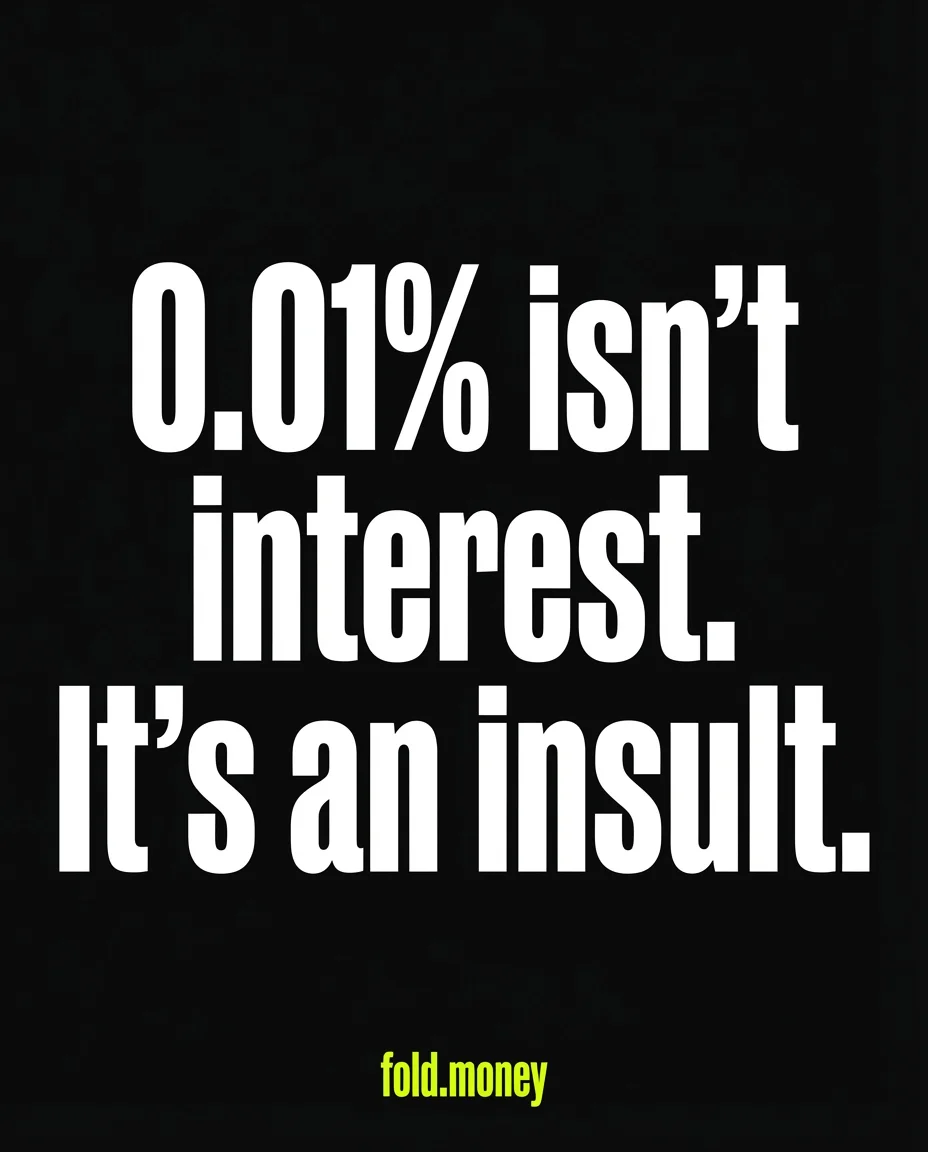
Bold Billboard
Your bank gives you 0.01% APY. We give you 4.5%.
Bold Billboard
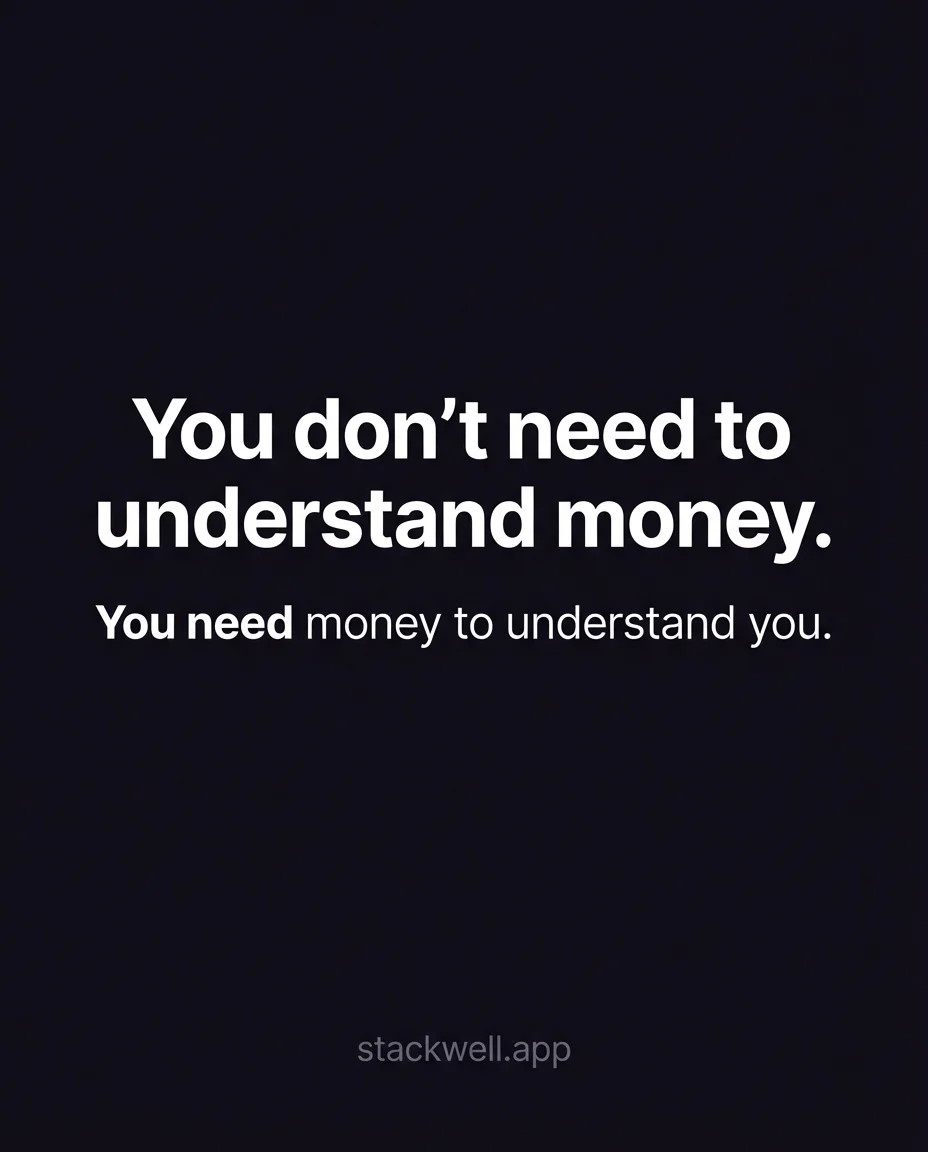
You don't need to understand money.
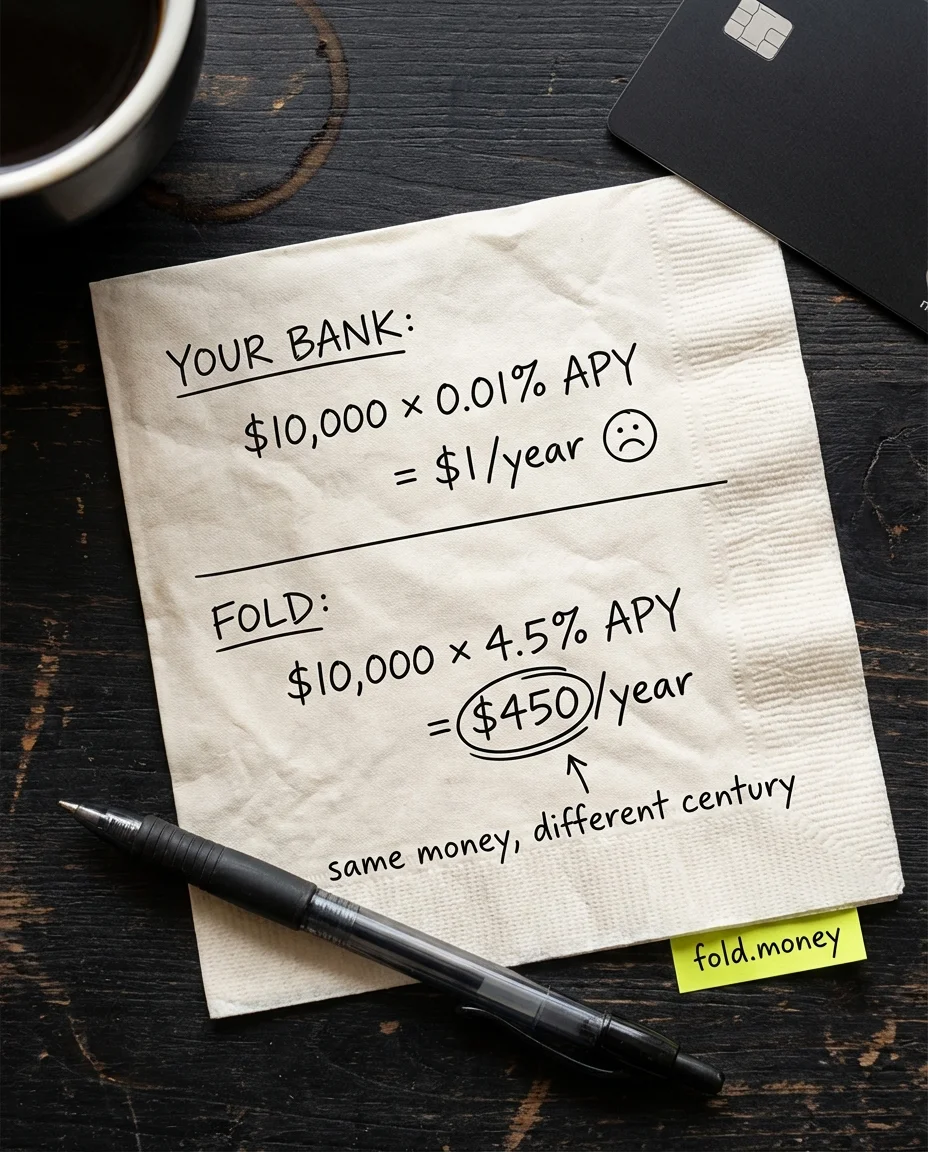
Napkin Math
Your bank is costing you $450/year. Here's the math.
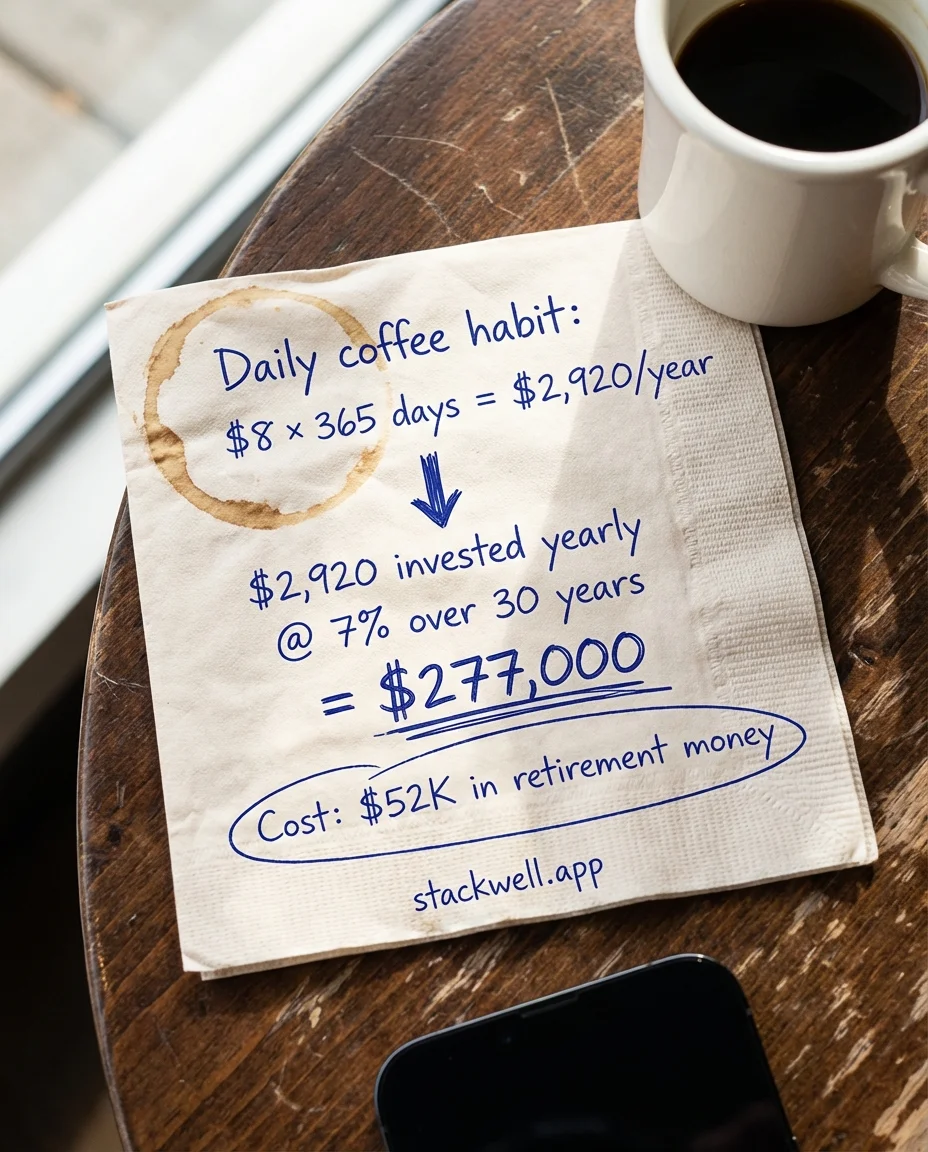
Napkin Math
This napkin math will haunt you.